
Capacity indication
Using the Capacity Indicator in TEQ
The Capacity Indicator helps you visualize the availability of buses for incoming requests and offers. By monitoring simultaneous departures, it shows whether capacity is high, medium, or low based on parameters you set.
Step 1: Enable the Capacity Indicator
- Go to Settings → Company Settings.
- In the Default subcategory, find the button Enable Capacity Indicator.
- Click to activate.
💡 Note: This feature is not enabled by default. Once activated, capacity information will appear for all new requests and offers.

Step 2: Set Capacity Limits
To configure capacity limits:
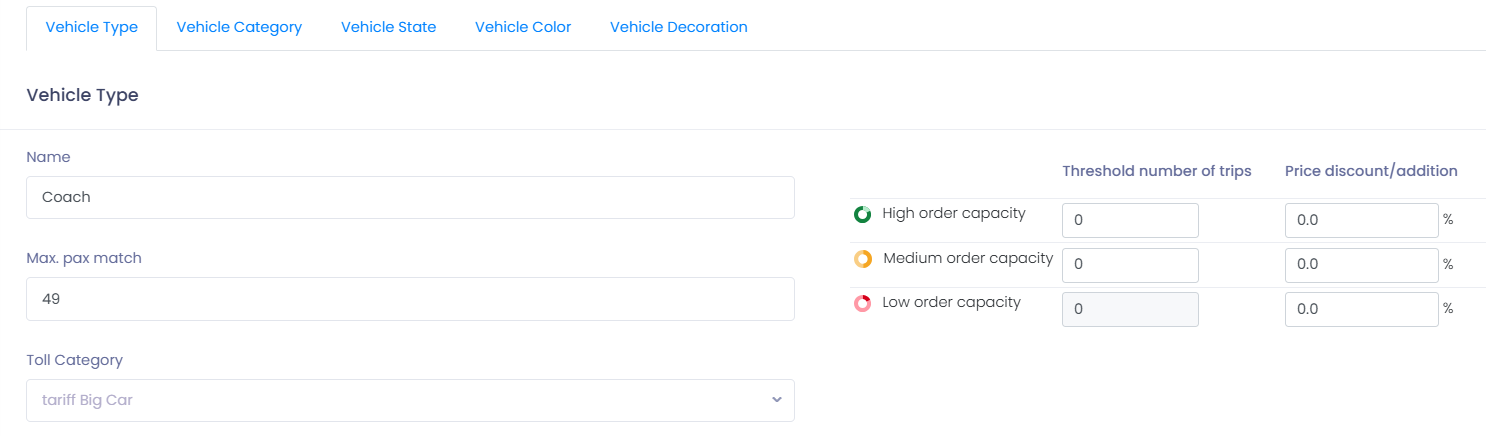
- Go to Settings → Vehicles.
- Select the vehicle type you want to configure.
- Define the values for High and Medium capacity.
- High Capacity → The maximum number of simultaneous trips considered "high."
- Example: Value = 45 → High capacity will be shown for 0–45 trips.
- Medium Capacity → A higher threshold for when availability becomes medium.
- Example: Value = 65 → Medium capacity shown between 46–65 trips.
- Must be higher than the High Capacity value.
- Low Capacity → Shown automatically when the number of trips exceeds the Medium threshold.
These limits provide real-time insights to prevent overloading your fleet.
How to Configure Department-Based Limits
- Go to Settings → Vehicles.
- Select the vehicle type you want to configure.
- Click the Show Department dropdown menu.
- Choose the department from the dropdown menu.
- Set specific thresholds for that department.
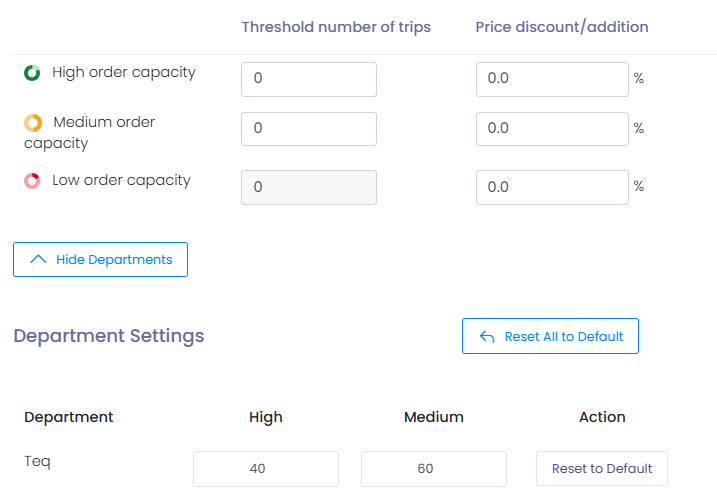
💡 Example:
- Department A: High = 40, Medium = 60
- Department B: High = 25, Medium = 40
This setup allows each department to have a more accurate reflection of real operational capacity based on its workload.
Capacity Thresholds at a Glance
The Capacity Indicator uses three levels — High, Medium, and Low — based on the thresholds you set.
| Capacity Level | Color | Example Thresholds |
|---|---|---|
✅ High Capacity | 🟢 Green | 0–45 trips (if High = 45) |
⚠️ Medium Capacity | 🟡 Yellow | 46–65 trips (if Medium = 65) |
❌ Low Capacity | 🔴 Red | 66+ trips (above Medium) |
Where You’ll See Capacity Indicators
Requests
- In Sales → Requests, a new Capacity column shows availability with three symbols (High, Medium, Low).
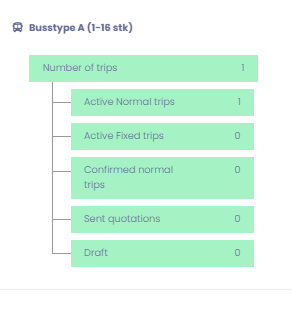
- Click the indicator to open a pop-up with details:
- Total trips
- Active normal trips
- Active fixed trips
- Confirmed trips
- Sent quotations
- Drafts
Offers
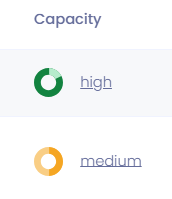
- During the offer process, you’ll see:
- A capacity indicator below the map.
- A bus-type symbol showing availability for the specific bus.
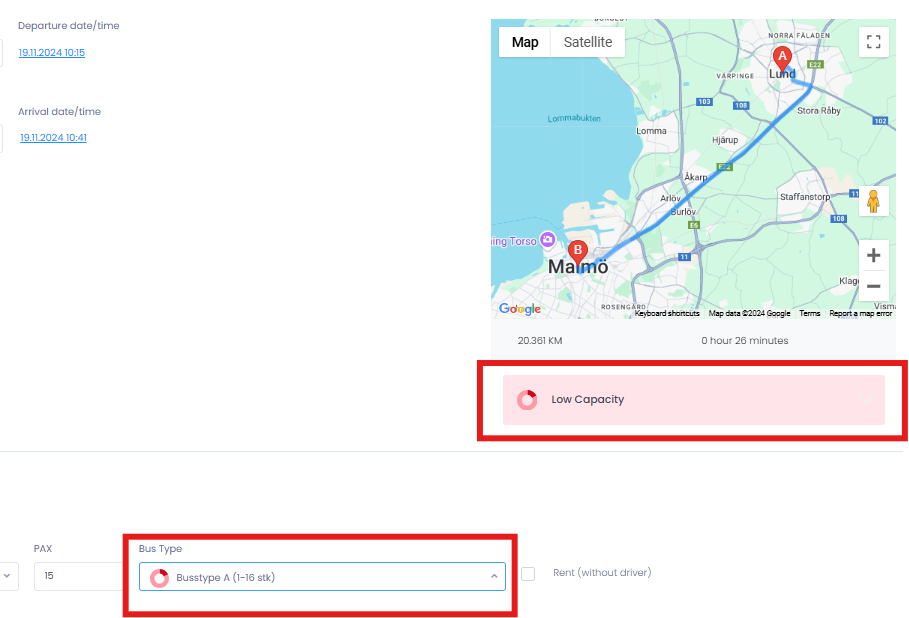
Bus Types
- In the bus type dropdown, each option displays its capacity symbol.
- Compare availability across different bus types to optimize fleet usage.
Capacity Indicator by Map
- Below the map, you’ll see the same detailed calculation overview as in requests.
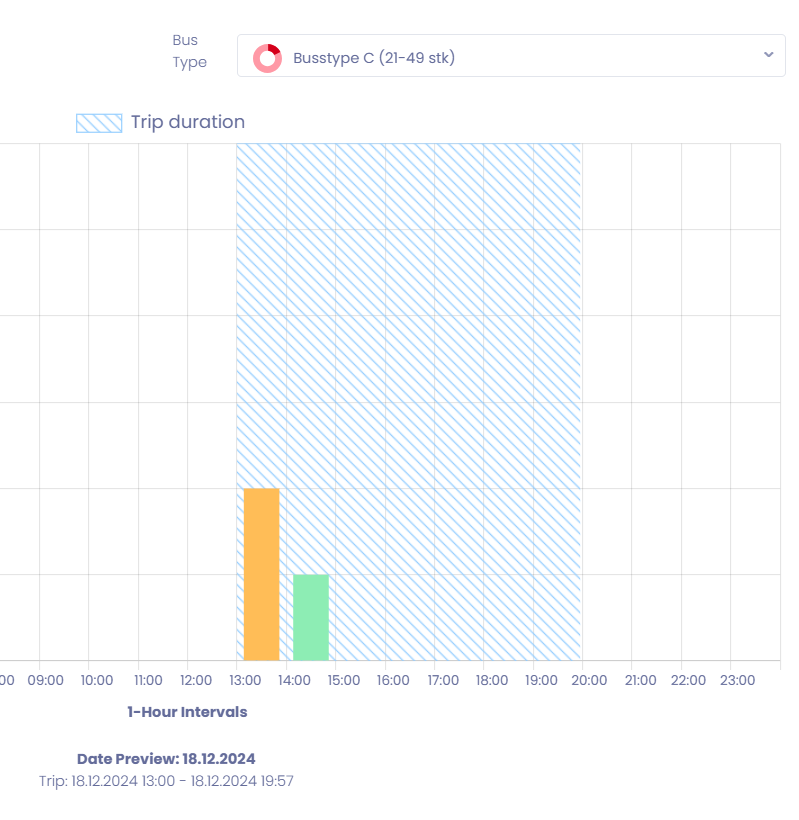
- Includes a link to Capacity view over time.
When opened, this view displays:
- Capacity across different times of the day.
- Prearranged trips per time block.
- A blue bar highlighting the trip you’re creating.
- Remaining capacity shown in green, yellow, or red bars.
💡 This layout helps you recommend alternative trip times that may be more cost-effective for your customers.
🛠 Troubleshooting
Capacity indicator not showing
- Check that it is enabled in Settings → Company Settings → Enable Capacity Indicator.
- Refresh your browser after activation.
Wrong capacity values
- Ensure High and Medium thresholds are set correctly.
- Remember that Medium must be higher than High.
Bus type not displaying capacity
- Verify that capacity limits are set for that specific bus type.
- Check that the bus type is active in your vehicle settings.
Indicator not updating with trips
- Make sure trips are properly logged as confirmed, sent, or draft.
- Refresh the Requests or Offers screen to reload values.
Still having trouble?
- Reach out to TEQ Support with screenshots of your capacity settings and affected bus type for faster resolution.